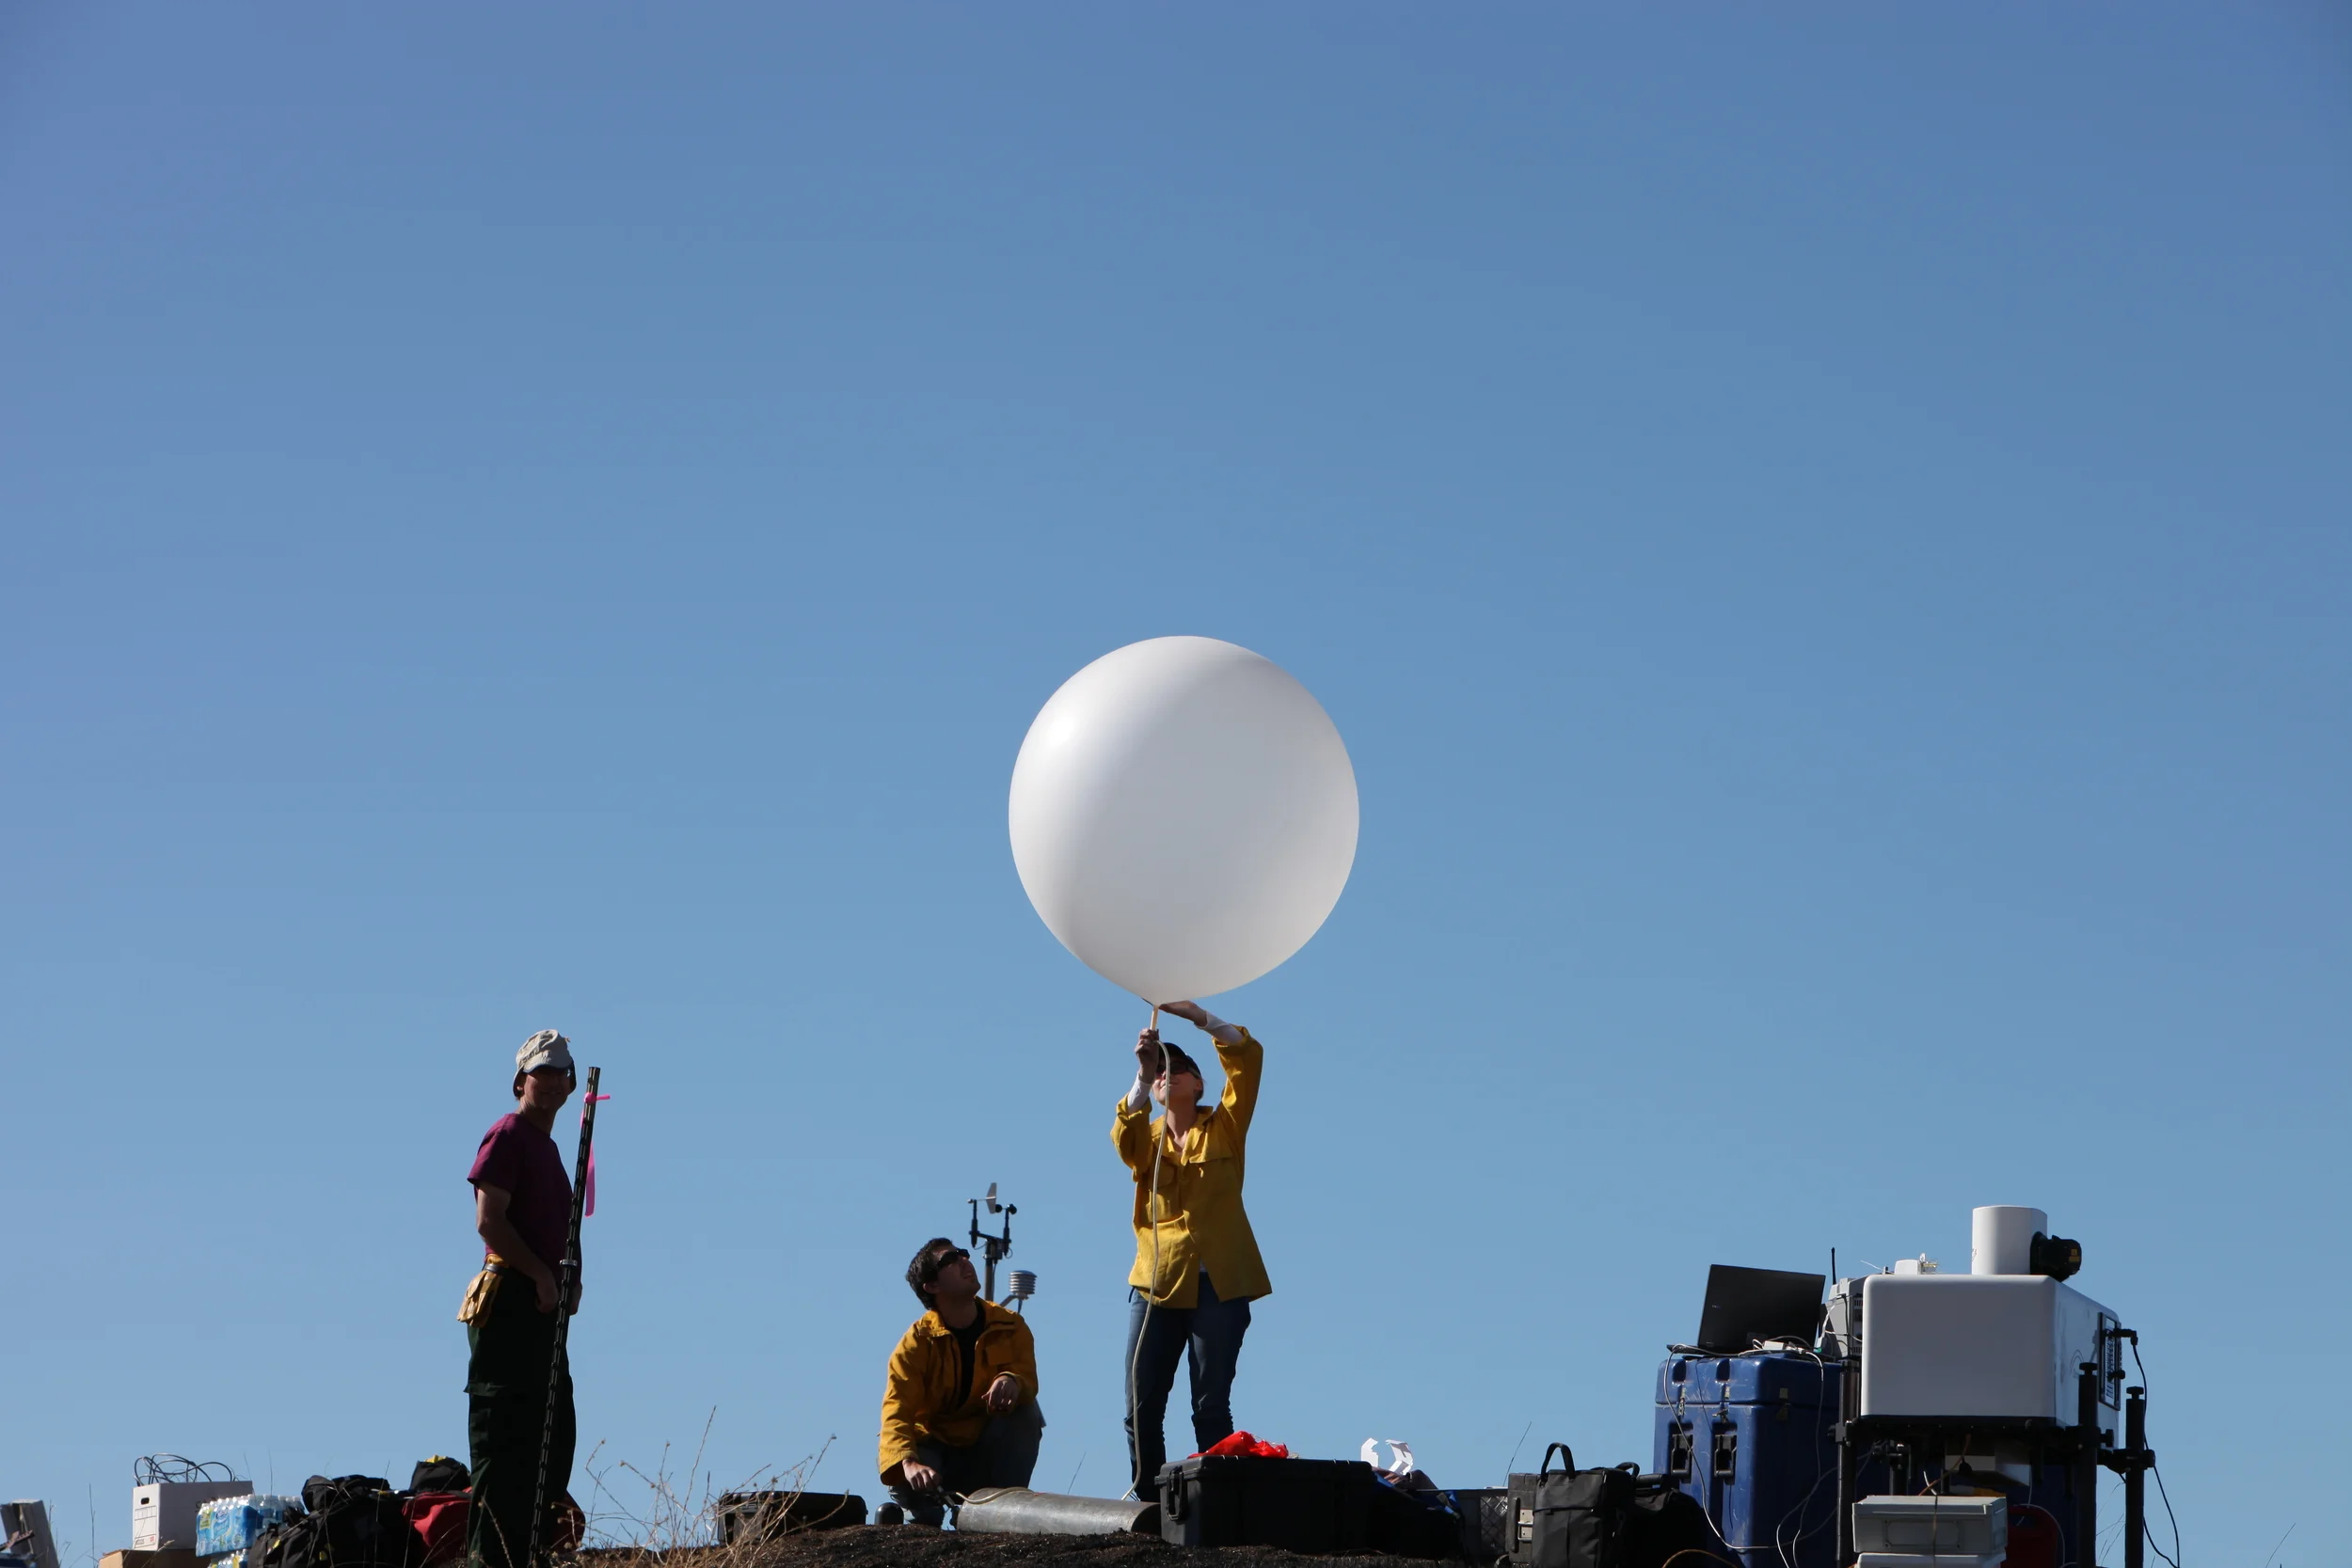
Unprecedented observations of rotating plumes and penetrative convection.
Read More

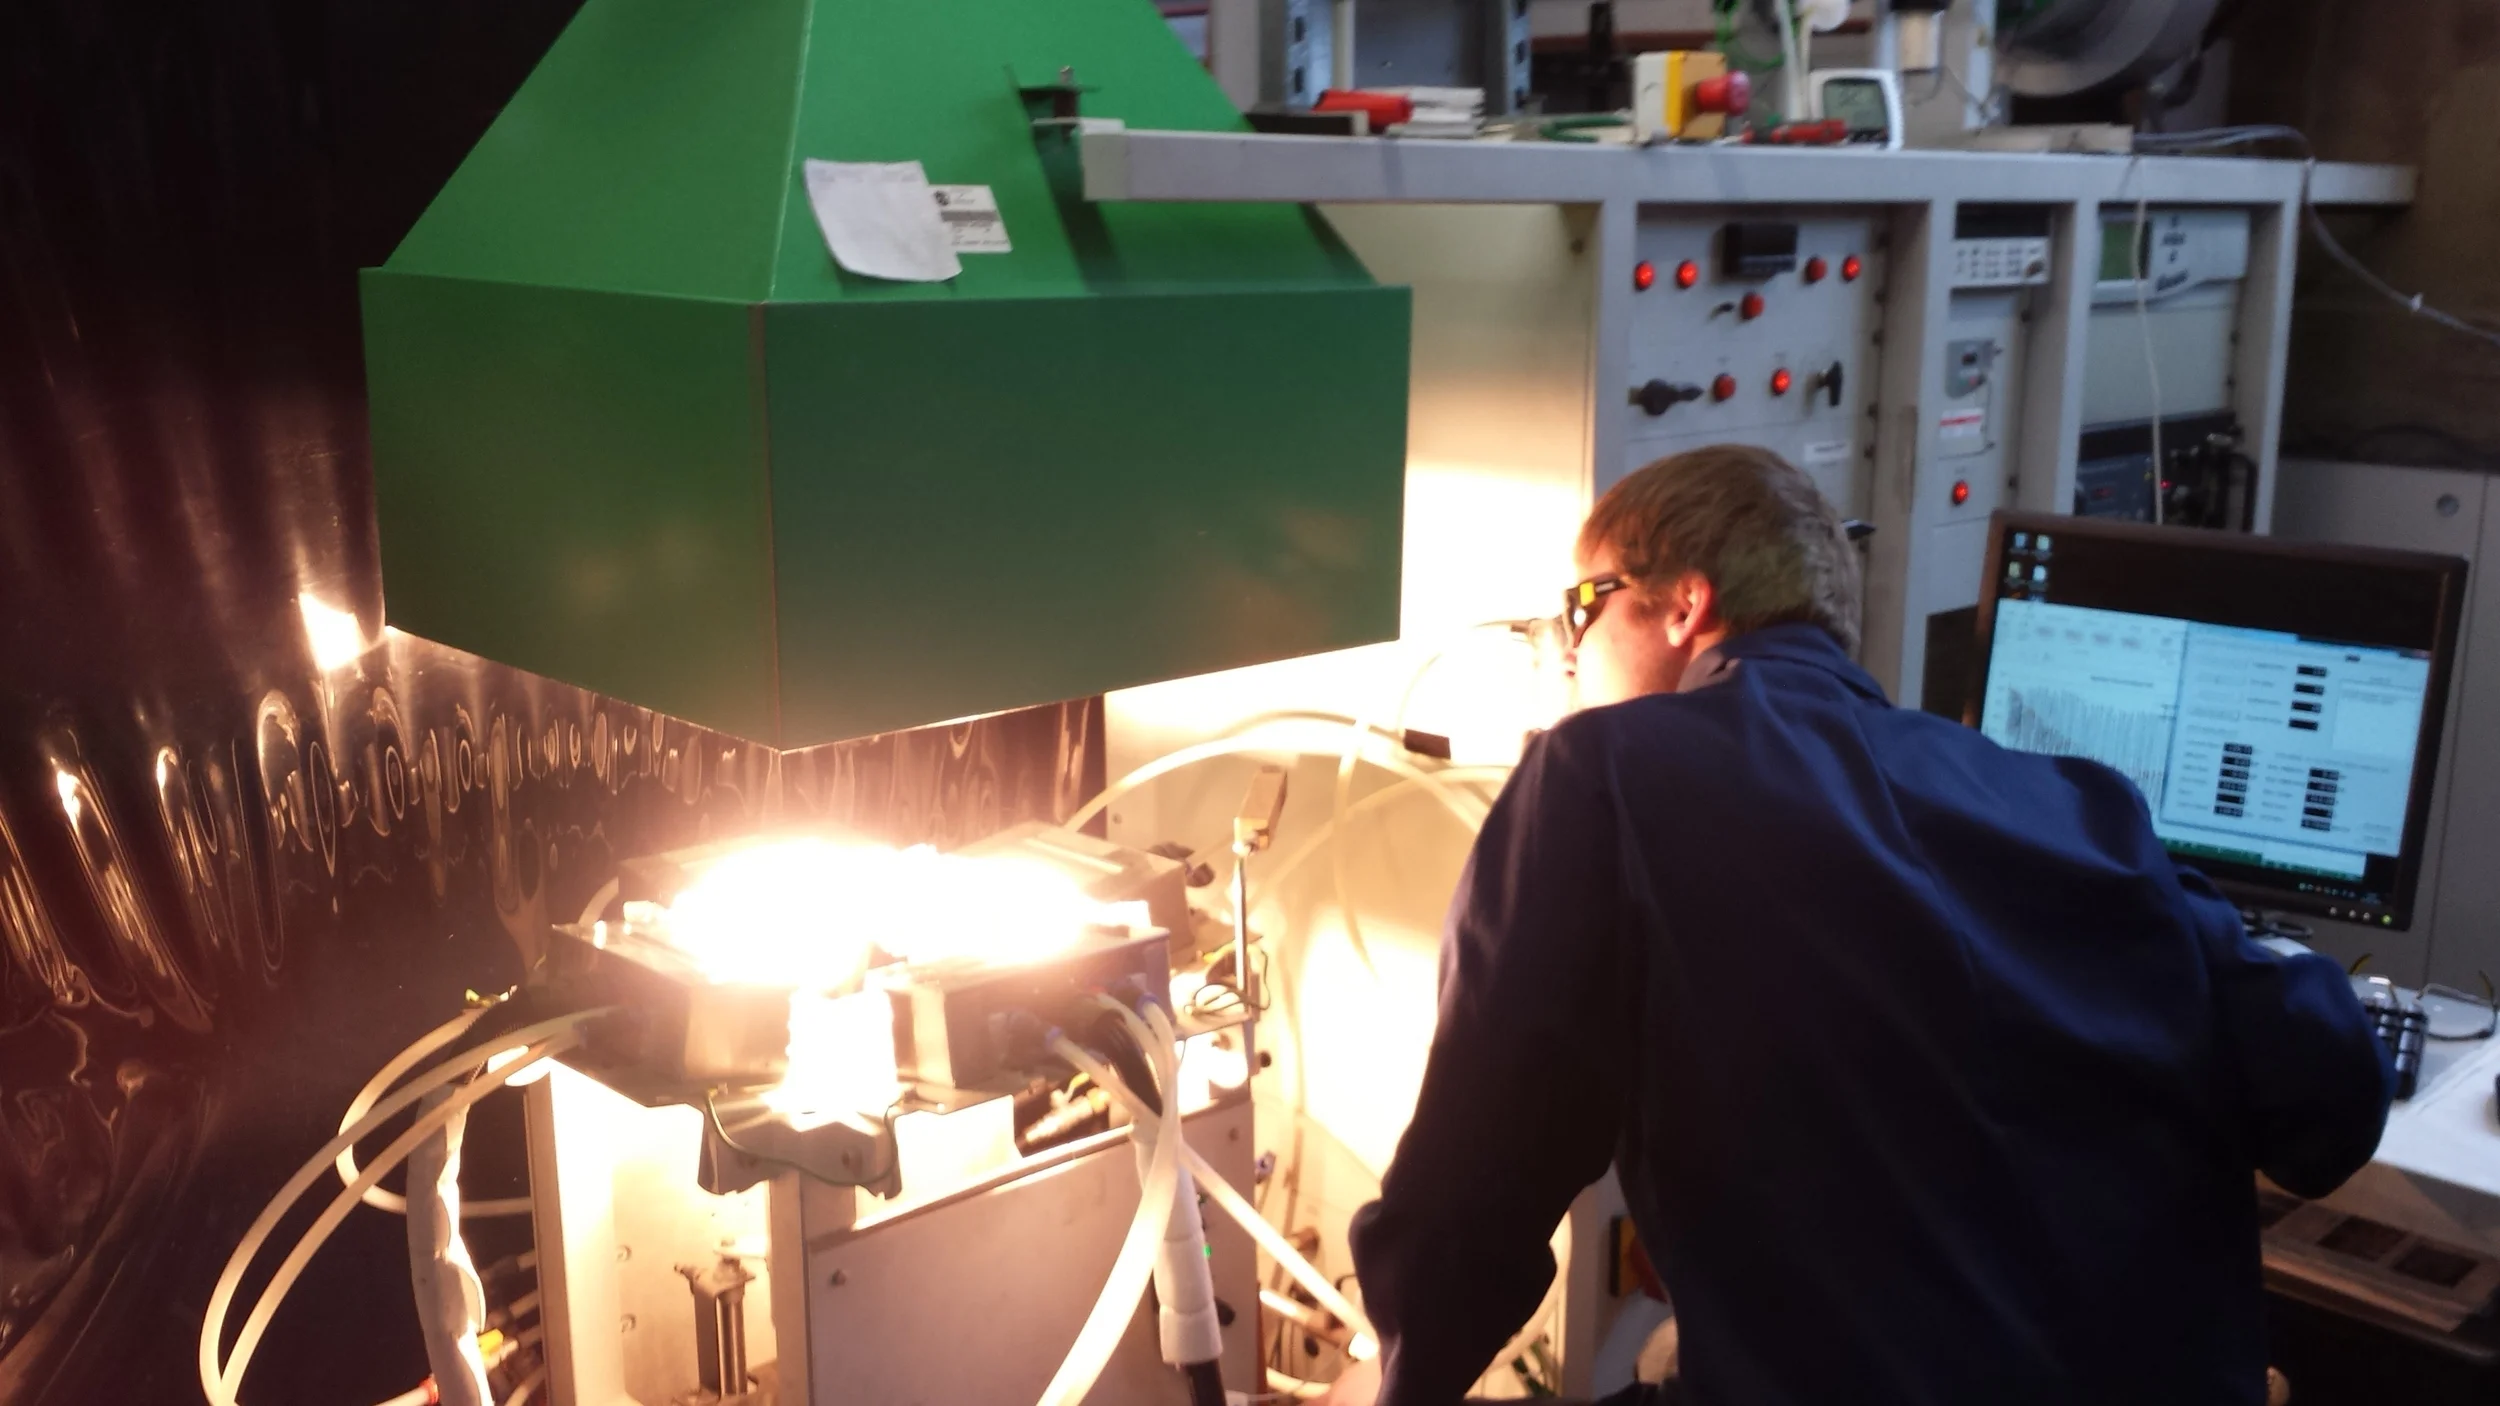
Unprecedented observations of rotating plumes and penetrative convection.
Read More